
About
Flourish is a no-code data-visualization and storytelling platform. Users can upload data, choose from 50+ chart and map templates, customize the visual design, add interactions, and publish responsive visualizations or stories to the web and presentations. Flourish also supports live data connections, scrollytelling, image/HTML exports, team collaboration, custom branding, an SDK, APIs, Flourish Assistant, and the MCP-based Flourish Connector.
✨ Key Features
- Create charts without code — Upload a dataset or begin from a template in the browser.
- Build maps and geographic visuals — Use interactive maps, tooltips, and geographic storytelling templates.
- Tell stories with data — Combine visuals, annotations, interactions, and scrollytelling into a narrative.
- Customize visual design — Adjust colors, typography, layout, animation, and interactive behavior.
- Add interactive elements — Use filters, tooltips, hover states, and animated transitions.
- Connect live data — Update visualizations from publicly accessible CSV files or Google Sheets where supported.
- Embed and share — Publish responsive graphics to websites, reports, presentations, and social channels.
- Export visuals — Export supported projects as PNG, JPEG, SVG, HTML, and other formats depending on the plan.
- Use Flourish Assistant — Refine charts with plain-language prompts and plan-specific allowance.
- Connect AI tools with MCP — Use Flourish Connector to start from an AI tool and continue editing in Flourish.
- Collaborate and control publishing — Share projects, manage folders/access, and use approval or duplication controls on eligible plans.
- Extend with SDK and APIs — Build custom templates and integrate visualization creation or rendering into other systems.
💳 Pricing
- Free —
$0; unlimited projects, the full template range, private unpublished data, public publishing/embedding with attribution, and responsive graphics. - Presenter — Available through a Canva Business or Enterprise plan; adds Flourish in Canva, project search inside Canva, attribution-free Canva/PowerPoint embeds, and image/SVG export.
- Publisher — Custom quote; adds team collaboration, attribution-free website embeds, scrollytelling, one custom theme, live Google Sheets/CSV updates, and HTML export for self-hosting.
- Enterprise — Custom quote; adds advanced security/access controls, SSO, multiple custom themes and hosted fonts, a live rendering API, dedicated account support, SLAs, invoicing, and compliance terms.
The current public page does not show fixed standalone prices for Presenter, Publisher, or Enterprise. Confirm whether Presenter is purchased through Canva and request a current quote for other paid plans.
⚖️ Alternatives Compared
| Product | Best for | Public pricing | Key difference |
|---|---|---|---|
| Flourish | Interactive data storytelling and publication | Free; Presenter through Canva; Publisher/Enterprise custom | Combines template-led charts, maps, scrollytelling, responsive embeds, and AI-assisted refinement |
| Datawrapper | Fast charts, maps, and newsroom publishing | Free and paid options | Strongly emphasizes straightforward publishing, annotations, and newsroom-friendly workflows |
| Tableau Public | Public interactive analytics | Free public platform | Provides a broader visual analytics environment with publicly shareable workbooks |
| Beautiful.ai | AI-assisted presentations | Paid plans; 14-day trial; eligible education offer separate | Focuses on slide creation rather than data-story visualization and embeddable interactive charts |
🎯 Use Cases
- Publishing responsive charts in an online article.
- Turning survey results into an interactive story.
- Building election, sports, or geographic maps.
- Presenting financial or marketing trends with interactive charts.
- Connecting a chart to a regularly updated CSV or Google Sheet.
- Creating scrollytelling for a newsroom or campaign.
- Embedding interactive visuals in presentations and reports.
- Applying a team’s colors, fonts, and logo across published work.
- Using AI assistance to refine a chart while retaining manual control.
- Integrating custom templates or rendering into a publication system.
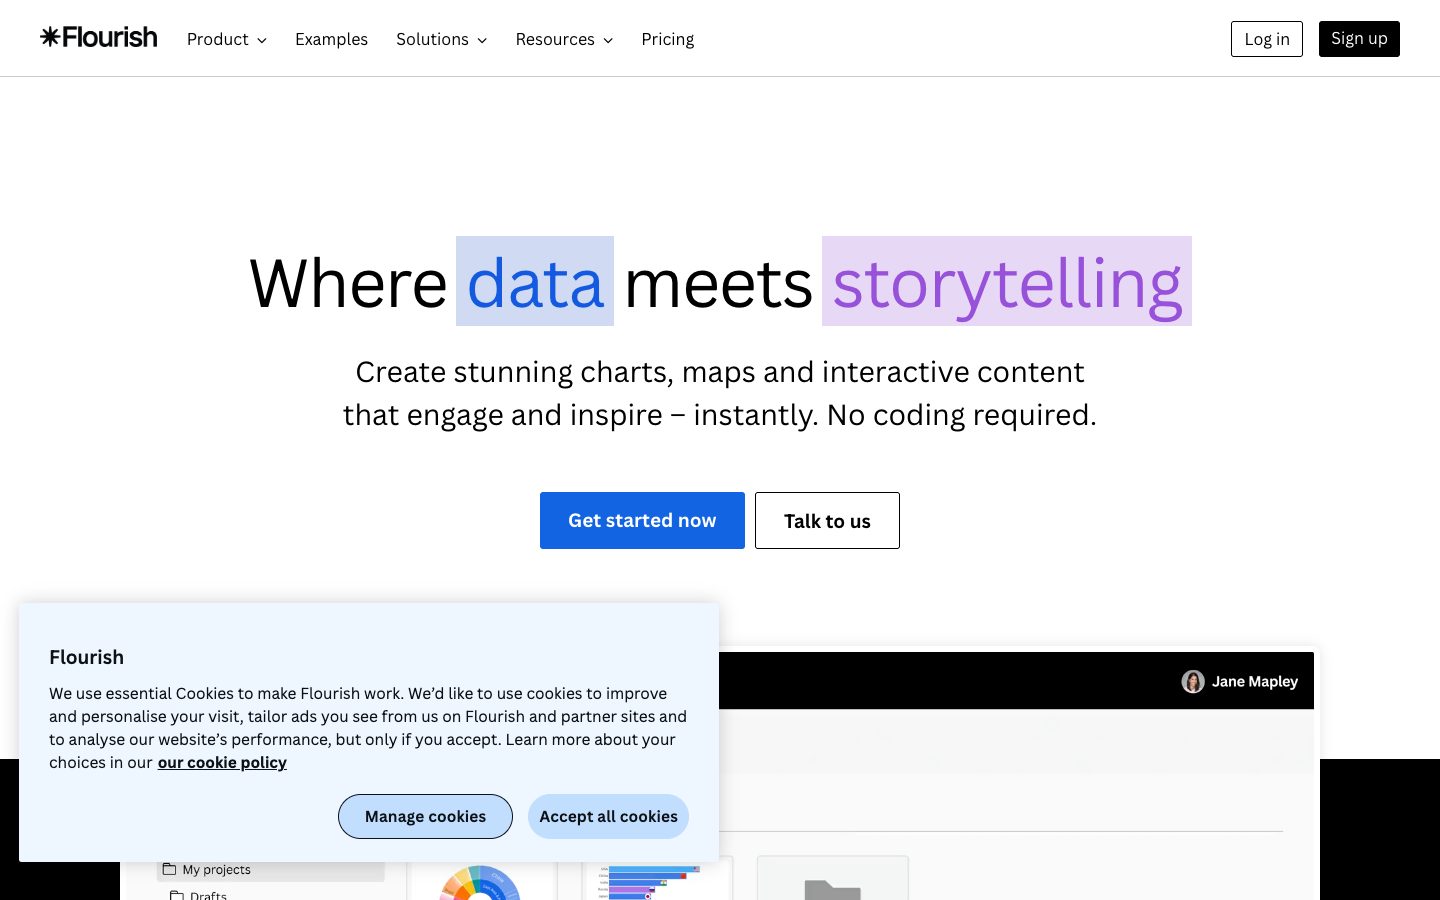
Flourish Website Overview
Flourish has an Ahrefs Domain Rating of 86 and falls within Cloudflare Radar's global top 20,000 popularity bucket. This bucket is unordered, and neither signal represents actual visits.
- Domain rating
- 86
- Popularity position
- Top 20,000
- Primary category
- Unavailable
- Ranked locations
- 0
Ahrefs
Cloudflare Radar
Cloudflare Radar
Cloudflare Radar
Website categories
No category data is available yet.
Top locations by rank
No location ranking is available yet.
Data coverage
Free popularity and domain-authority signals only; no estimated visits or engagement metrics are shown.
Sources: Domain Rating by Ahrefs · Cloudflare Radar · Oct 18, 2026. Cloudflare Radar data is licensed under CC BY-NC 4.0.
Similar tools
Observable
FreeCollaborative computational notebooks for analysis, visualization, and data apps
Deepnote
FreemiumCollaborative data notebooks with AI, integrations, and deployable data apps
PandasAI / Annie
FreemiumOpen-source conversational data analysis and a separate paid Annie dashboard with a trial
Portable Picks
FreeCurated portable-device discovery, specification comparisons and benchmark information
Tableau Public
FreeTableau Public is free data visualization platform with AI-assisted chart recommendations.
Zillow Zestimate
FreeZillow Zestimate is free AI property valuation with price history and neighborhood trends.