
Dynatrace
Paid15-day free trialAI-powered observability and security platform for complex cloud environments
About
Dynatrace is an AI-powered observability and security platform for applications, infrastructure, logs, user experiences, containers, and AI workloads. OneAgent, Grail, OpenPipeline, PurePath, Dynatrace Intelligence, dashboards, and DQL connect telemetry and context across environments. The platform supports application and infrastructure monitoring, log analytics, real user and synthetic monitoring, code monitoring, application security, and AI observability for LLMs and agents.
✨ Key Features
- Monitor applications and infrastructure — Collect metrics, dependencies, traces, and service health across cloud and data-center environments.
- Use OneAgent — Deploy an agent to collect relevant telemetry across the application-delivery chain.
- Trace requests with PurePath — Follow distributed requests end to end and inspect code-level context.
- Process telemetry with Grail and OpenPipeline — Ingest, enrich, correlate, and query data at scale.
- Analyze logs with DQL — Transform, retain, and query logs in context with other signals.
- Monitor digital experiences — Track real-user sessions, mobile experiences, and synthetic browser/HTTP journeys.
- Monitor code and databases — Troubleshoot production code and database performance.
- Protect applications and infrastructure — Detect vulnerabilities and integrate security findings with observability.
- Observe AI systems — Track LLM and agent performance, cost, quality, compliance, hallucinations, prompt injection, and PII exposure.
- Automate operations with Dynatrace Intelligence — Explore data in natural language and coordinate AI-assisted operations.
- Manage usage and cost — Use platform commitments, rate-card pricing, forecasting, and consumption controls.
💳 Pricing
Dynatrace offers a 15-day free trial. Ongoing access is paid and usage-based; the trial is not a permanent free tier.
Dynatrace uses a Platform Subscription with an annual commitment and usage-based rate card rather than a small set of fixed software plans. Key public rate-card entries include:
- Foundation & Discovery —
$0.01/host-hour(shown as$7/month); basic host health, topology, filesystem, and OS-service monitoring. - Infrastructure Monitoring —
$0.04/host-hour(shown as$29/month); infrastructure observability and custom metrics. - Full-Stack Monitoring —
$0.01/memory-GiB-hour(shown as$58 per 8 GiB host/month); infrastructure plus APM, root-cause analysis, code profiling, Kubernetes, and OpenTelemetry. - Kubernetes Platform Monitoring —
$0.002/pod-hour(shown as$1.40/month); Kubernetes metrics, events, health, and topology. - Code Monitoring —
$0.005/container-hour(shown as$3.60/month); live production troubleshooting and debugging. - Log Analytics — ingest/process
$0.20/GiB, retain$0.0007/GiB-day, and query$0.0035/GiB-scannedunder the pay-per-query model; bundled-query retention has a separate rate. - Real User Monitoring —
$0.00225/session; Session Replay$0.0045/session replay capture. - Synthetic Monitoring — Browser Monitor
$0.0045/synthetic action; HTTP Monitor$0.001/synthetic request. - Automation Workflow —
$0.03/workflow-hour.
The official rate card contains additional database, security, telemetry, classic, and platform-extension meters. Customers receive access to generally available capabilities under the platform commitment; larger commitments can reduce unit prices and there are no penalty-style overages.
⚖️ Alternatives Compared
| Product | Best for | Public pricing | Key difference |
|---|---|---|---|
| Dynatrace | Full-stack observability, security, and AI workloads | Usage-based Platform Subscription and public rate card | Unifies application, infrastructure, logs, experience, security, and AI observability with agentic operations |
| Datadog | Cloud monitoring and observability | Product- and usage-based pricing | Provides a broad SaaS observability catalog with host, event, log, and trace meters |
| New Relic | Application and infrastructure observability | Free and usage-based plans | Emphasizes telemetry analysis, application monitoring, and developer observability workflows |
| Grafana | Open-source and cloud observability | Free and paid options | Centers dashboards, open-source components, and a broad telemetry ecosystem |
🎯 Use Cases
- SRE teams tracing distributed application failures.
- Platform teams monitoring cloud and data-center infrastructure.
- Developers debugging production code and database performance.
- Security teams connecting vulnerabilities to runtime context.
- Product teams understanding real-user web and mobile journeys.
- Operations teams analyzing logs and telemetry with DQL.
- Kubernetes teams monitoring pods, workloads, and topology.
- AI teams measuring LLM cost, quality, latency, and compliance.
- Finance and platform leaders forecasting usage against annual commitments.
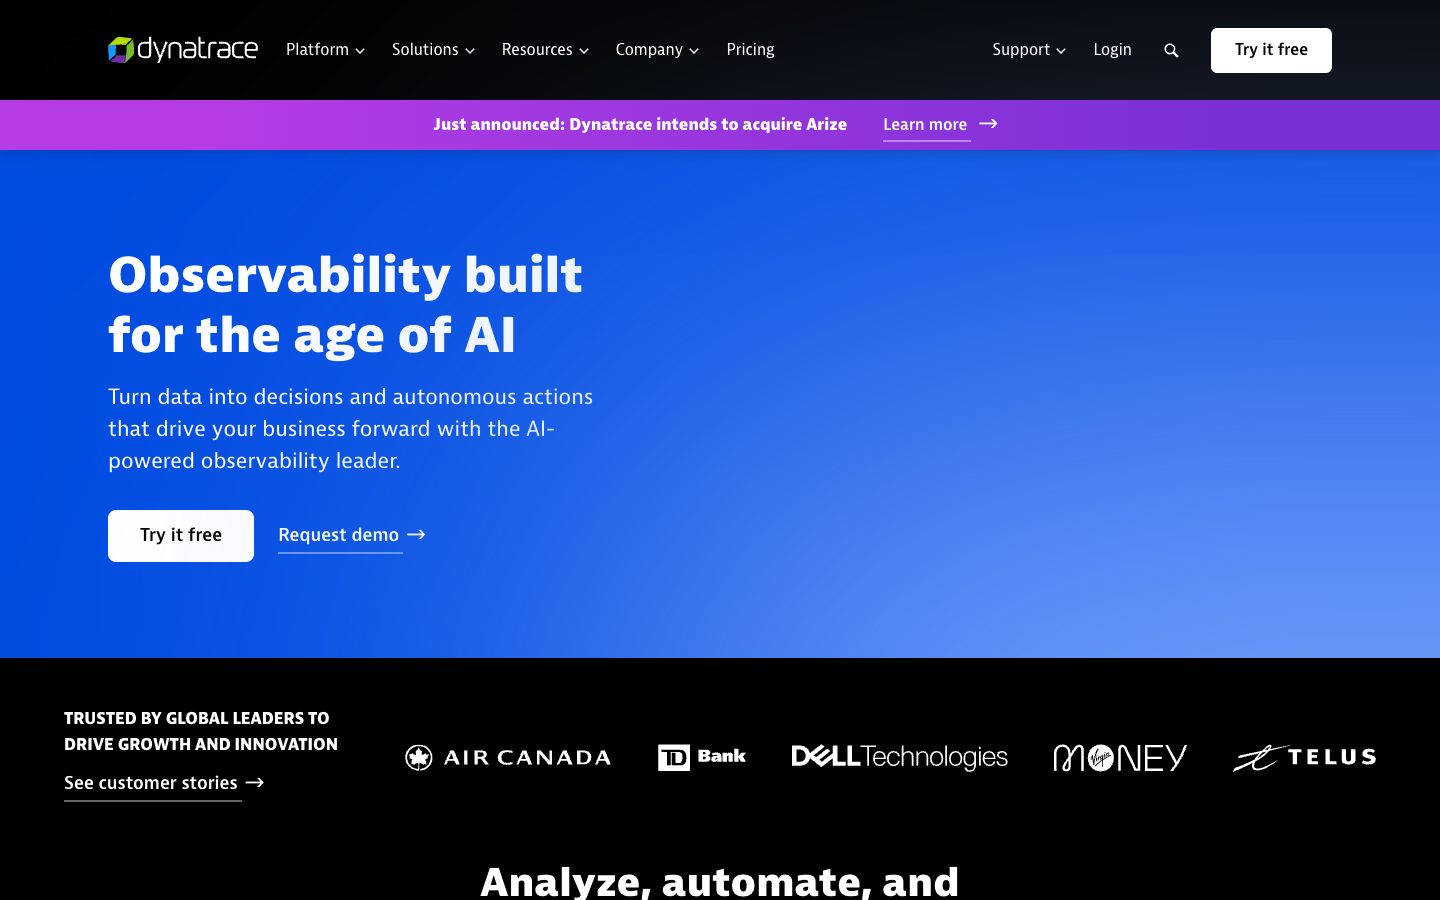
Dynatrace Website Overview
Dynatrace has an Ahrefs Domain Rating of 84 and falls within Cloudflare Radar's global top 500 popularity bucket. This bucket is unordered, and neither signal represents actual visits.
- Domain rating
- 84
- Popularity position
- Top 500
- Primary category
- Unavailable
- Ranked locations
- 0
Ahrefs
Cloudflare Radar
Cloudflare Radar
Cloudflare Radar
Website categories
No category data is available yet.
Top locations by rank
No location ranking is available yet.
Data coverage
Free popularity and domain-authority signals only; no estimated visits or engagement metrics are shown.
Sources: Domain Rating by Ahrefs · Cloudflare Radar · Oct 18, 2026. Cloudflare Radar data is licensed under CC BY-NC 4.0.
Similar tools
Elastic
FreemiumSearch, vector database, observability, and security platform for data-driven applications
Datadog
FreemiumCloud monitoring and observability platform for infrastructure, applications, logs, and security
New Relic
FreemiumFull-stack observability platform for application performance, infrastructure, logs, digital experience, security, AI operations, and usage-based monitoring
Splunk
FreemiumEnterprise platform for security, observability, log analytics, and AI-powered operational insights
Grafana
FreeOpen-source observability platform for querying, visualizing, exploring, and alerting on telemetry
PagerDuty
FreemiumAI-first operations platform for incident response, on-call coordination, automation, and AIOps