
Grafana
FreeOpen-source observability platform for querying, visualizing, exploring, and alerting on telemetry
About
Grafana is an open-source observability platform for querying, visualizing, and alerting on metrics, logs, and traces. Grafana OSS provides dashboards and data-source plugins for systems such as Prometheus, Loki, Elasticsearch, SQL databases, and cloud monitoring services. Grafana Cloud adds managed telemetry storage, integrations, alerting, and operational features, while Grafana Enterprise adds commercial plugins, support, and governance for self-managed deployments.
✨ Key Features
- Data-source connections — Query metrics, logs, traces, profiles, SQL databases, APIs, and cloud monitoring systems without moving the source data into Grafana.
- Dashboards and panels — Arrange query results into reusable dashboards with panels, rows or tabs, links, annotations, and visualization-specific controls.
- Explore and query editing — Run free-form queries against a data source, inspect results, and iterate before turning an investigation into a dashboard panel.
- Grafana Alerting — Evaluate queries and expressions from multiple data sources, define alert rules, and route notifications through contact points and notification policies.
- Metrics, logs, and traces correlation — Explore Prometheus/Mimir metrics, Loki logs, Tempo traces, and other signals in connected views for incident investigation.
- Dashboard sharing and reporting — Share dashboards or panels through links, snapshots, embeds, and exports; Grafana documentation also describes automatic PDF reporting.
- Access control and administration — Manage organizations, folders, teams, roles, data-source permissions, and other administration settings; Enterprise and Cloud add deeper governance controls.
💳 Pricing
Grafana OSS is free to self-manage, with infrastructure and operating costs borne by the operator. Grafana Cloud has a Free tier and paid usage.
| Signal | Free monthly allowance | Pro starting usage rate after included allowance |
|---|---|---|
| Metrics | 10,000 active series | US$6.50 per 1,000 series |
| Logs | 50 GB ingested | US$0.050/GB processed, US$0.400/GB written, US$0.100/GB retained |
Pro has a US$19/month platform fee; rates vary by volume. Free retention is 14 days; listed Pro retention is 13 months for Metrics and 30 days for Logs. Cloud Enterprise uses custom terms with a US$25,000 annual minimum commitment where listed. Check product-specific units and the current calculator.
⚖️ Alternatives Compared
| Product | Best for | Public pricing | Key difference |
|---|---|---|---|
| Grafana | Flexible dashboards and open observability workflows | OSS is free; Cloud Free, Pro usage-based, and Enterprise custom | Separates visualization/querying from the stores where telemetry lives and supports a broad plugin model |
| Datadog | Integrated SaaS monitoring and security | See official pricing | Packages observability, security, digital experience, and service-management products in one SaaS platform |
| New Relic | Full-stack observability with unified telemetry | Free entry and custom/usage-based offerings | Emphasizes a unified telemetry data layer plus application, infrastructure, logs, digital experience, and AI monitoring |
| Splunk | Enterprise observability and business context | See official pricing | Correlates metrics, logs, traces, events, applications, infrastructure, and digital experience in its managed observability portfolio |
🎯 Use Cases
- SRE incident response — Correlate metrics, logs, and traces in dashboards and Explore to investigate an outage or elevated error rate.
- Kubernetes and infrastructure monitoring — Connect Prometheus, cloud monitoring, databases, or other sources and track service health in reusable views.
- Application performance troubleshooting — Query request metrics and logs, annotate deployments, and use alert rules to shorten detection and diagnosis loops.
- Centralized alert operations — Evaluate signals across multiple data sources, route notifications to the right contact point, and manage alert policies from one view.
- Managed telemetry at scale — Use Grafana Cloud integrations and usage controls when a team prefers hosted storage, retention, and support options.
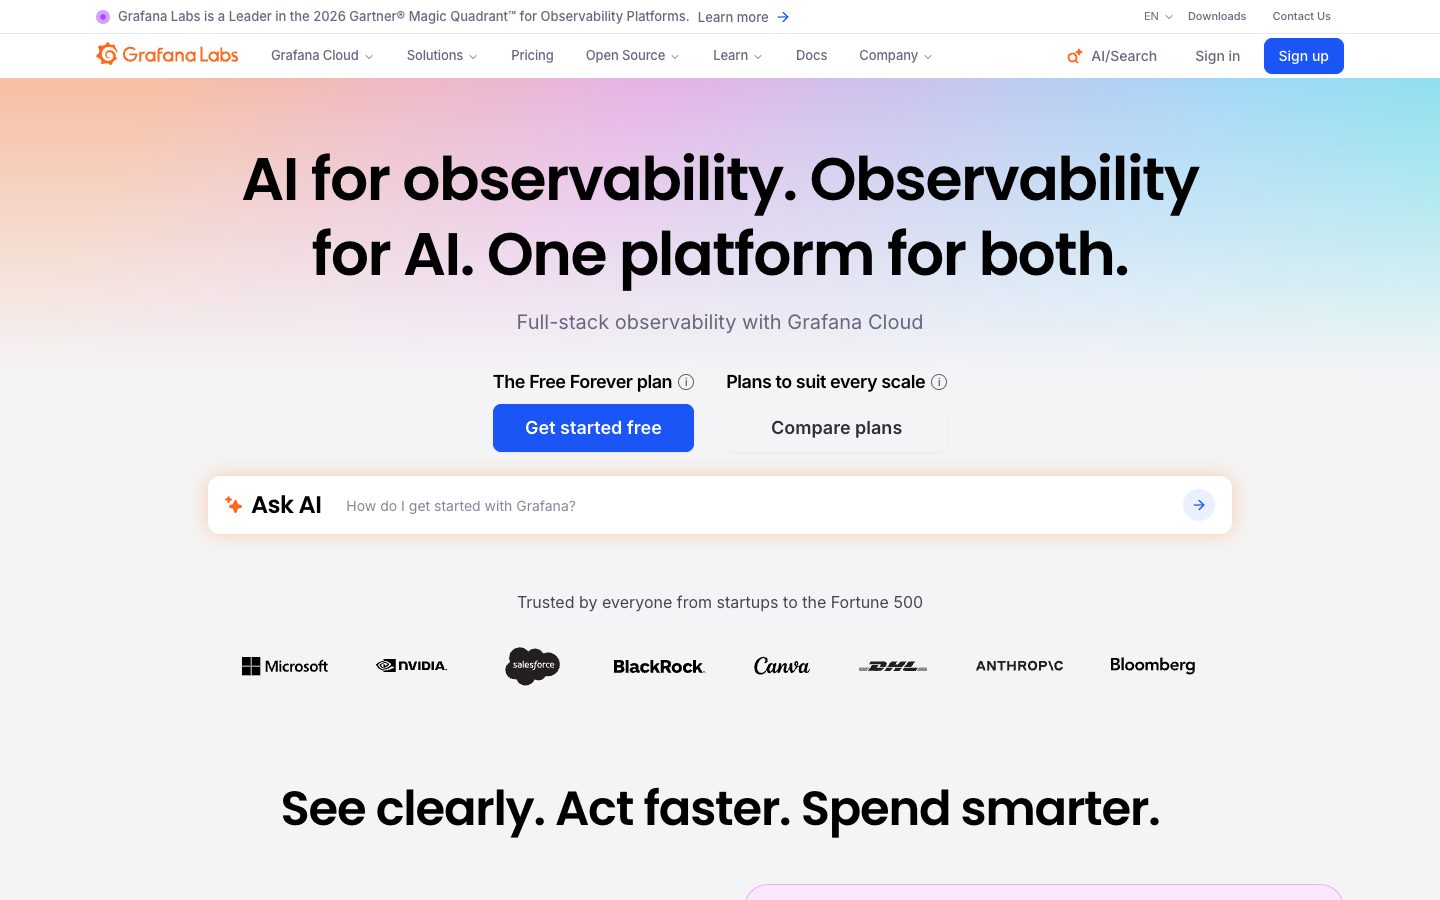
Grafana Website Overview
Grafana has an Ahrefs Domain Rating of 89 and falls within Cloudflare Radar's global top 1,000 popularity bucket. This bucket is unordered, and neither signal represents actual visits.
- Domain rating
- 89
- Popularity position
- Top 1,000
- Primary category
- Unavailable
- Ranked locations
- 0
Ahrefs
Cloudflare Radar
Cloudflare Radar
Cloudflare Radar
Website categories
No category data is available yet.
Top locations by rank
No location ranking is available yet.
Data coverage
Free popularity and domain-authority signals only; no estimated visits or engagement metrics are shown.
Sources: Domain Rating by Ahrefs · Cloudflare Radar · Oct 18, 2026. Cloudflare Radar data is licensed under CC BY-NC 4.0.
Similar tools
Elastic
FreemiumSearch, vector database, observability, and security platform for data-driven applications
Datadog
FreemiumCloud monitoring and observability platform for infrastructure, applications, logs, and security
Dynatrace
PaidAI-powered observability and security platform for complex cloud environments
New Relic
FreemiumFull-stack observability platform for application performance, infrastructure, logs, digital experience, security, AI operations, and usage-based monitoring
Splunk
FreemiumEnterprise platform for security, observability, log analytics, and AI-powered operational insights
PagerDuty
FreemiumAI-first operations platform for incident response, on-call coordination, automation, and AIOps