
New Relic
FreemiumFull-stack observability platform for application performance, infrastructure, logs, digital experience, security, AI operations, and usage-based monitoring
About
New Relic is a cloud observability platform for collecting, querying, visualizing, and alerting on telemetry across applications, infrastructure, services, browsers, mobile apps, synthetics, and logs. Its platform includes APM with distributed tracing, infrastructure monitoring, error tracking, digital experience monitoring, log management, serverless monitoring, dashboards, alerts, integrations, and AI-assisted operations. New Relic AI and related intelligent-observability capabilities help engineers investigate incidents and understand system behavior, but New Relic remains an observability platform rather than a general-purpose AI agent. Pricing is based on users and data ingest or on compute capacity and data ingest, not on host count.
✨ Key Features
- Application Performance Monitoring — Monitor application transactions, response times, errors, dependencies, and distributed traces.
- Infrastructure monitoring — Observe hosts, containers, cloud services, Kubernetes, and system health without per-host charges.
- Log management — Ingest, search, analyze, and correlate logs with application and infrastructure telemetry.
- Distributed tracing and service maps — Follow requests across services and visualize dependencies and bottlenecks.
- Error tracking — Detect, group, and investigate application errors and regressions.
- Digital Experience Monitoring — Monitor browser, mobile, and synthetic experiences, including scripted availability checks.
- Dashboards, queries, and alerting — Use NRQL and dashboards to investigate data and notify teams about conditions.
- AIOps and New Relic AI — Apply AI-assisted investigation and operational insights to observability data where the edition and enabled capability permit.
- Security monitoring — Analyze security data and use Security RX capabilities within the applicable pricing and data model.
- Transaction 360 and intelligent observability — Bring transaction context and related signals together for deeper troubleshooting.
- Integrations and agents — Connect more than 700/780 integrations and collect telemetry from major cloud, language, database, and infrastructure ecosystems.
- Governance, APIs, and ecosystem tooling — Use log obfuscation, Data Plus, retention options, EU data-center storage, and enterprise controls; automate configuration, queries, dashboards, alerts, and observability workflows through APIs.
💳 Pricing
- Free and Standard — Free is $0 forever with no credit card required, 100 GB monthly ingest, one full-platform user, unlimited basic users, 50+ capabilities, at least 8-day retention, log obfuscation, and 500 synthetic checks. Standard is for small teams with up to 5 full-platform users, ticketed support, a 2-business-day SLA, and SAML SSO; listed user pricing starts at $10 for the first full-platform user, with core users at $49/user.
- Pro — Edition for larger or more complex workloads; unlimited full-platform users, commitment options, and a 2-hour critical initial support response SLA. The reviewed pricing page lists $349/full-platform user for annual commitments or $418.80/user for monthly pay-as-you-go; core users are $49/user.
- Enterprise — Custom pricing; Pro features plus priority ticket routing, a 1-hour critical initial support response SLA, and eligibility for FedRAMP Moderate and HIPAA with Data Plus. Core users remain listed at $49/user; full-platform pricing is contact sales.
- Data ingest — The first 100 GB/month is free; original data is $0.40/GB beyond that, or $0.60/GB for Data Plus. EU data-center storage adds $0.05/GB/month, and extra synthetic checks are listed at $0.005/check.
- Advanced Compute — Optional usage-based compute for capabilities such as Transaction 360, Security RX, Cloud Cost Intelligence, and New Relic AI. New Relic also offers a compute pricing model with no user fees, where applicable.
Basic users are free on every edition but have more limited permissions; core and full-platform users unlock additional capabilities. Access and billing can change when Advanced Compute, Data Plus, retention, or other add-ons are enabled. Confirm the edition, user type, ingest option, compute model, retention, region, and annual commitment before estimating cost.
⚖️ Alternatives Compared
| Product | Best for | Public pricing | Key difference |
|---|---|---|---|
| New Relic | Full-stack observability with user/data or compute/data pricing | Free tier; Standard and Pro publish user rates; Enterprise custom; ingest from $0.40/GB | Broad telemetry platform with APM, infrastructure, logs, digital experience, security, and AI operations |
| Datadog | Unified monitoring across cloud and application stacks | Free trials and usage-based product pricing; see official pricing | Large modular observability suite with many separately metered products |
| Grafana | Open-source and hosted dashboards/observability | Open-source and Cloud/Enterprise plans; see official pricing | Strong open-source ecosystem and dashboard-first workflows with flexible deployment choices |
| Dynatrace | Enterprise application and infrastructure intelligence | Consumption-based; contact or calculate via official pricing | Enterprise automation and causal intelligence orientation with a different deployment and pricing model |
🎯 Use Cases
- Production application monitoring: Trace requests, identify slow transactions, and investigate errors.
- Incident response: Correlate metrics, logs, traces, and changes while diagnosing an outage.
- Cloud and Kubernetes operations: Monitor infrastructure, containers, services, and capacity.
- Digital experience monitoring: Track browser, mobile, synthetic, and end-user performance.
- SRE and reliability programs: Set alerts, service-level views, dashboards, and operational runbooks.
- Security and compliance observability: Analyze security data and apply obfuscation, retention, and governance controls.
- AI application monitoring: Observe AI-related workloads and use New Relic AI or intelligent-observability features where licensed.
- Engineering productivity: Surface telemetry in IDEs, automate platform workflows, and connect observability to incident tools.
New Relic can process application telemetry, logs, user-experience data, security data, and potentially sensitive identifiers. Configure obfuscation, retention, access roles, regional storage, data governance, and alert destinations before sending production data. Treat AI-generated investigations as recommendations and verify them against traces, logs, and metrics.
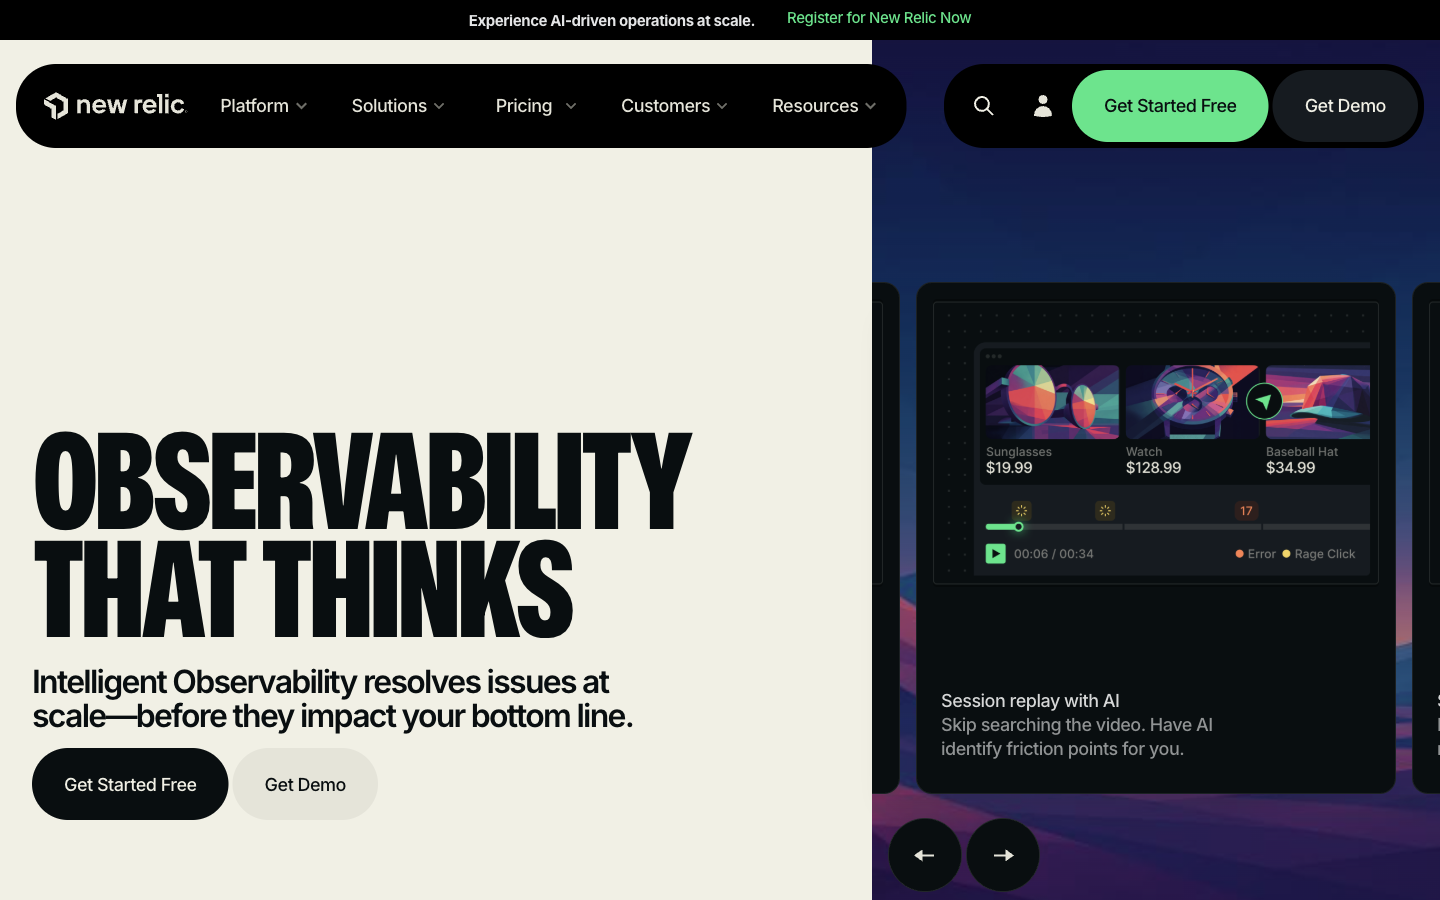
New Relic Website Overview
New Relic has an Ahrefs Domain Rating of 88 and falls within Cloudflare Radar's global top 500 popularity bucket. This bucket is unordered, and neither signal represents actual visits.
- Domain rating
- 88
- Popularity position
- Top 500
- Primary category
- Unavailable
- Ranked locations
- 0
Ahrefs
Cloudflare Radar
Cloudflare Radar
Cloudflare Radar
Website categories
No category data is available yet.
Top locations by rank
No location ranking is available yet.
Data coverage
Free popularity and domain-authority signals only; no estimated visits or engagement metrics are shown.
Sources: Domain Rating by Ahrefs · Cloudflare Radar · Oct 19, 2026. Cloudflare Radar data is licensed under CC BY-NC 4.0.
Similar tools
Elastic
FreemiumSearch, vector database, observability, and security platform for data-driven applications
Datadog
FreemiumCloud monitoring and observability platform for infrastructure, applications, logs, and security
Splunk
FreemiumEnterprise platform for security, observability, log analytics, and AI-powered operational insights
Dynatrace
PaidAI-powered observability and security platform for complex cloud environments
Grafana
FreeOpen-source observability platform for querying, visualizing, exploring, and alerting on telemetry
PagerDuty
FreemiumAI-first operations platform for incident response, on-call coordination, automation, and AIOps